
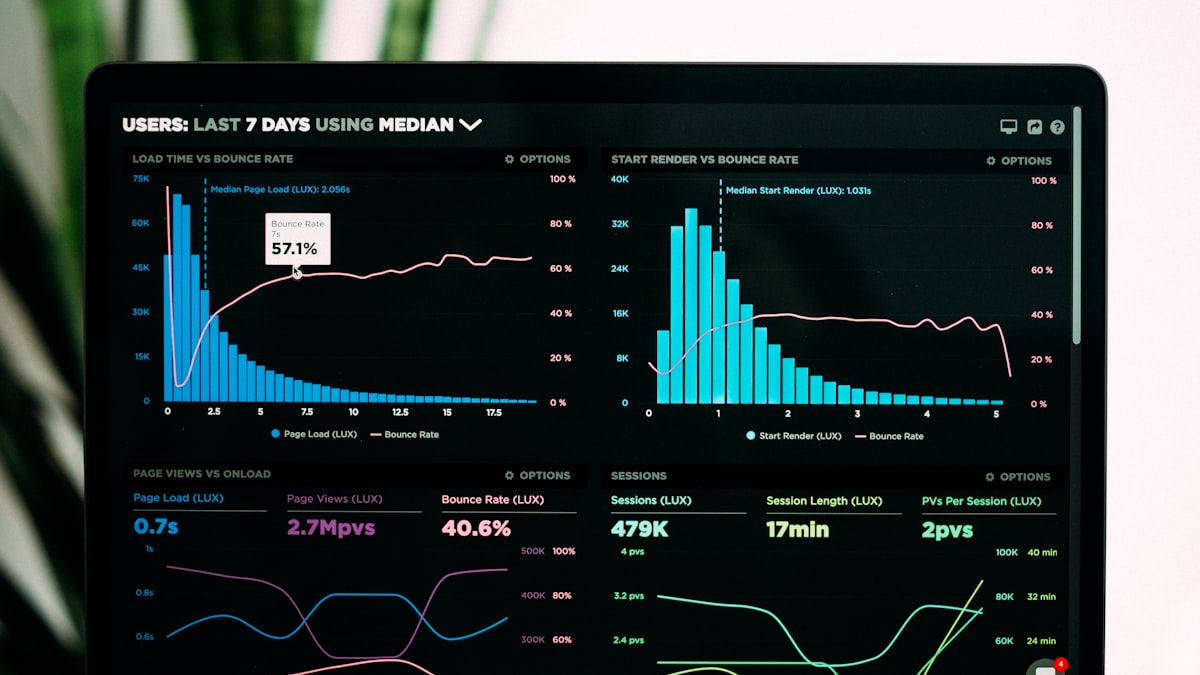
Most unused dashboards aren't unused because the data is wrong — they're unused because nobody could act on what they showed. A dashboard with forty metrics on one screen isn't more useful than one with five; it's just harder to read. Here's what separates a dashboard people actually check from one that gets built once and forgotten.
Design around a decision, not a data source
Before building a single chart, ask: what decision is this dashboard meant to inform, and who makes it? A dashboard for a sales VP deciding where to allocate territory resources looks nothing like one for an ops manager tracking daily fulfillment SLAs — even if both pull from the same underlying data. Building from the data schema outward, instead of the decision backward, is the most common reason dashboards end up cluttered.
Every chart should answer one question
If a chart requires a paragraph of explanation to interpret, it's usually trying to answer too many questions at once. Break it apart. A well-designed dashboard reads in seconds — the viewer sees a chart, understands the finding, and knows whether it warrants action, all before they've had to think about how to read it.
Surface exceptions, not just totals
Executives rarely need to see that revenue was "on target" — they need to know when something wasn't. Dashboards that highlight variance from expectation (red/amber/green status, thresholds, week-over-week deltas) get checked far more often than ones that just display raw totals, because they do the first pass of analysis for the viewer instead of leaving it as homework.
Match the refresh rate to the decision cycle
A dashboard refreshed hourly is wasted on a metric that only gets reviewed monthly — and a dashboard that lags a day behind is useless for an operational decision that needs to happen within the hour. Refresh cadence should be set by how often the underlying decision actually gets made, not by what's technically easiest to schedule.
Self-service only works with guardrails
Giving every user the ability to build their own views sounds efficient, but without a shared semantic layer — consistent metric definitions, a single source of truth for what "active customer" or "qualified lead" means — self-service BI tends to produce dashboards that disagree with each other. Invest in the semantic layer before rolling out broad self-service access.
Review usage, not just accuracy
Most BI teams track whether dashboards are correct, but few track whether they're actually opened. Login and view analytics on your BI platform will tell you which dashboards are load-bearing and which were built once for a meeting and never revisited — a useful input for deciding where to invest further design effort.
A dashboard's value isn't in how much data it displays — it's in how quickly it helps someone make a better decision than they would have without it. Designing backward from that decision is what separates a report from a tool people actually rely on.
Want a second opinion on your current dashboards?
Talk to Us